OVERVIEW
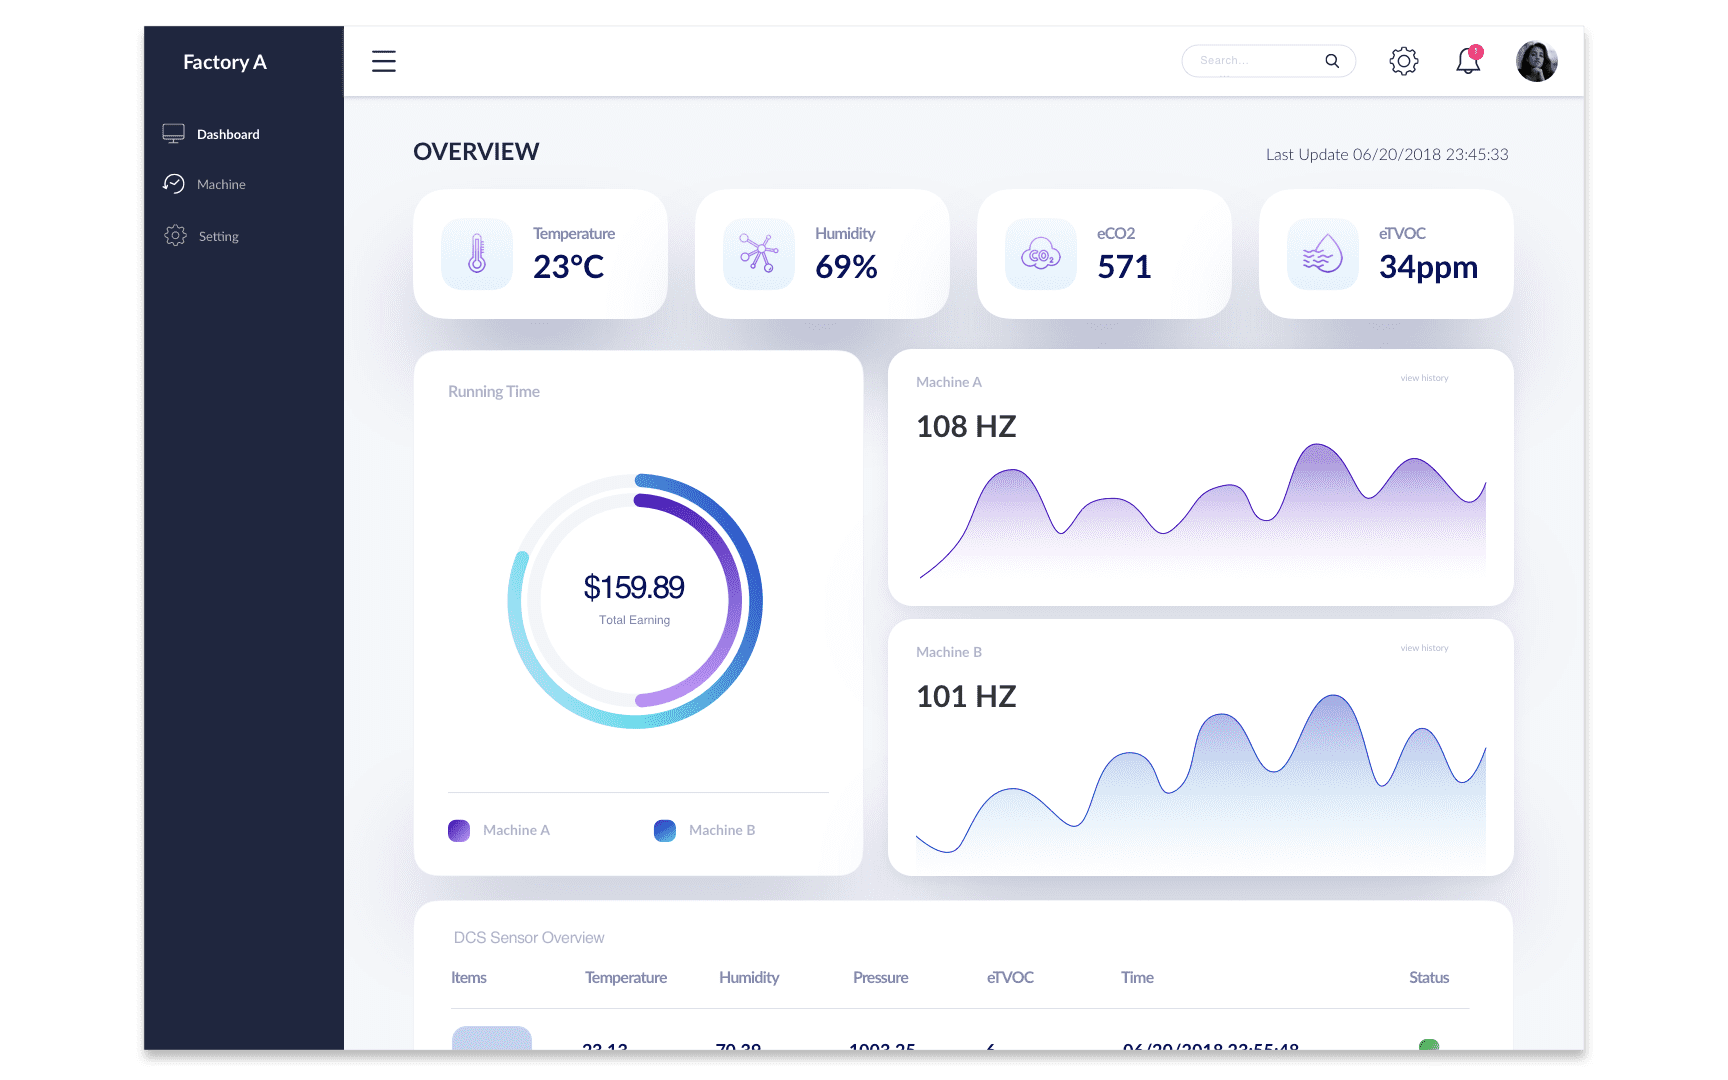
Predictive maintenance is one of the biggest benefits of Industry 4.0 smart factories. In this
project, our team is using an IoT + AI solution to provide our customers with a visualization
dashboard to monitor machines and to warn managers about urgent services or risk of breakdown.
* This work is under NDA. Please feel free to contact me to learn more details.
TYPE
a cross-functional team project
TIMELINE
3 month (Jun-Aug 2018)
TEAM
1 designer, 2 data analysts, 3 engineers, 1 project manager
TOOLS
Sketch, Power BI
CONTRIBUTION
Data Visualization
DESIGN PROCESS
01. Project Kickoff
We found out the opportunity of predicting machine maintenance for factories based on analyzing relative data. In the kickoff meeting, I learned the concept of this project. I also met factory managers after the meeting to know the resources and people that I could ask for the project.

02. Research
Learned about the solution and its use cases
What is the solution to predictive maintenance? By putting some sensors around
each machine, we collected real-time data to monitor the machine status.
Analyzing the collected data and visualized the result on the dashboard. The
dashboard will also alert managers when a machine is unstable, so managers can
be aware of it and solve the problem before the machine shuts down suddenly.
Research the scope of the project
To understand user needs, I interviewed factory workers and managers, to
understand
what
figures and what information is important to them. I also talked with data
scientists to
know what insights can be provided based on the data.


03. Critical user journey
Based on the insights that I gained from research, I created several user journeys to define different use cases. The critical user journeys help me better define the use cases, pain points, and what information users need when they are using the dashboard.
04. Design & Iteration
After defining the critical user journey, I started to visualize my ideas. I created wireframes and low-fi prototypes to deliver my ideas. I shared the design with my teammates and factory managers to make sure the information is what the need and the user flow is right. I iterated the design and created several variations in this phase.


05. Deliver the final design on Power BI.
After discuss and iterate the design for a few times, I moved my prototype to Power BI and connected the real data to execute the dashboard.